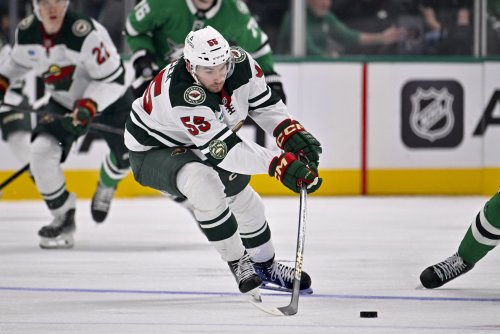
New head coach Bruce Boudreau will have the final say on the forward lines and defensive pairings, but we can look at different stats and try to see how this roster can be constructed.
I went ahead and made some depth charts using different stats to rank each player. Now, I assembled them with two wingers, trying my best to keep players on the side they normally play.
Courtesy of the Star Tribune
I took this depth chart and then ranked them by Shot Attempt percentage. Shot Attempt percentage is calculated by taking all shot attempts for his team while a player is on the ice and dividing it by the whole number of on-ice shot attempts.
That first line certainly is intriguing as it allows both Staal and Nino, who are possession masters, control play against the best checking lines of the opposition. With Pominville, who isn’t a slouch off the puck (even if last year was an off year), he can look for the soft spots on the ice for scoring chances.
Shot Attempts are but just one factor on the ice. Hockey is, in its most basic form, about putting the puck in the net, after all. This next chart is the roster of players ranked by total points.
A couple things shake out with this line-up. First is that Eric Staal is the 2nd line center, but with Nino and Coyle on his flanks, it makes for yet another beast of a line - at least on paper. This would also is yet another chart that frees Niederreiter from the depths of this roster and should allow him to play the minutes he’s deserved so far. And the third line is pure speed with Zucker and Haula on the same line.
We can drill down into the point production a little further by using rate statistics. Points per 60 minutes is different from the normal points per game as time on ice per game varies per player. This stat places everyone on an even keel, by taking the total points and total time on ice and dividing it by 60 minutes. Much like ERA is per nine innings for a baseball pitcher, this gives a rate that allows us to directly compare how efficient a player is for on-ice point production in the minutes they see in a game.
So far, every depth chart has Niederreiter in the top 6, with these stats often having among the top two on the team. Now, I don’t think Erik Haula is ready for a first line role, nor would I want Chris Stewart in the top six. But to look a the line-up in a different way is intriguing nonetheless.
Overall, the way Russo has the depth chart constructed will likely reflect what we’ll see, but as you can see, Nino doesn’t belong on the third line, and there should be a concerted effort to play around with any and all line combos in training camp. Players shouldn’t just get awarded a first line role, or be subjected to a third line role just because they have large contracts, more years of service, or some other strange and odd way of assembling the line-up that doesn’t have to do with pure on-ice performance.
Think you could write a story like this? Hockey Wilderness wants you to develop your voice, find an audience, and we'll pay you to do it. Just fill out this form.


Recommended Comments
There are no comments to display.
Join the conversation
You can post now and register later. If you have an account, sign in now to post with your account.
Note: Your post will require moderator approval before it will be visible.