

By Brandon -
So far, the analytics community contributing to Rob Vollman’s Hockey Abstract has done little to convince anyone of their status as a possible home-seed in the postseason. There’s been a lot of be skeptical about. Even without the tables and numbers, there are a few of us at HW that are peering at the 2017-18 Minnesota Wild, not entirely sure of what exactly “got better” for them.
In the first two stories, I covered Minnesota’s possession, shootout ability, goaltending, and their penalty kill. Apart from Dubnyk holding down the fort and giving the Wild a seventh-best ranking of the, now, 31 NHL teams, all other parts of Vollman and Friends’ ranking criteria show the Wild as an average team.
Once again, here are the 13 criteria that the Hockey Abstract has used when evaluating teams for the 2017-18 season:
Today, I’ll be focusing on the Wild’s power play and their scoring line, and once again the rankings from The Abstract do little to qualm the storm of questions rattling around my head about the viability of analytics.
The Power Play
When looking at the Wild’s team breakdown page, the frustration sets in. Vollman writes, “Minnesota is roughly average in almost every category, including the power play.” Even with a 9th place finish last season, a 21.0% success rate, Minnesota is ranked 15th in terms of “Attempted Shots per 60 Minutes on the Power Play.”
Once again, this is comprised of a weighted average over the past three seasons. There are some terrible teams at the top saved by a few seasons of being incredibly good paired with ones where they’re incredibly bad.
If the Wild were ranked by percentage alone, they’ve finished 9th (21.0%), 15th (18.5%), and 27th (15.9%) in the last three seasons. It’s pretty erratic, however, when looking at shots, it’s a little different.
In shots per 60 the last three seasons, they’re pretty consistent: 97.0, 98.4, 98.6 for a weighted average of 98.3. The “elite” teams on this list (in the power play at least) generate over 100 shots on the peepers per 60.
Now, when just thinking about shots per 60 minutes, it goes along the lines of “just throw it at the net and maybe it will go in”. The Law of Averages is what makes the Bruins number one on the Abstract’s list. It’s also where my mind starts to race.
In 2014-15, the Bruins attempted more shots than 28 other franchises, but were 17th in the league in productivity. Same can be said about Anaheim, a team that generated over 103 shots per 60, but had the 28th ranked power play in the same year.
On the other side of this, Detroit was middle of the road when it came to shot generation that season, but they finished with 70 goals and the second highest efficiency. Columbus was another top five power play in terms of efficiency, and finished with the 8th lowest shots per 60 in that season.
Quality over quantity.
On this list, only one team, the Washington Capitals, are a top shot-generating power play unit that also was a top five efficiency team. You want a team that will score goals and take advantage of their opportunities, not one that throws pucks at the net after tossing caution into the wind.
Another qualm is the same I had with shots suppressed per 60 on the PK: sample sizes. No two teams has the exact same number of opportunities to play with a man (or more) advantage. Only the Nashville Predators have had the same amount of opportunities in the last three seasons: 259 in each of them (ranked 9th in the Abstract).
It works along the same argument as points per game. The smaller the size, the better you can look. What happens when those instances when you’re on the advantage grows?
I also would like to take a closer look on how divisional play affects a team’s numbers. You see this argument in football: is my team elite, or are they just a product of their conference/division?
This isn’t to discount the success of shot generation and suppression in terms of winning games. It is. Put pucks on net and the goals will come. However, I’m not clamoring for Boudreau to head out there and have his boys die on the hill of a “shoot at all times” mentality.
Scoring Line
Let’s be clear, this doesn’t always mean a team’s top line. The Abstract explains it as the line getting the majority of the offensive zone starts and the one that gets the nod from the coach late in games. They use the example of: Crosby is the number one line, but Malkin’s line is the one that get’s the draws in the OZ.
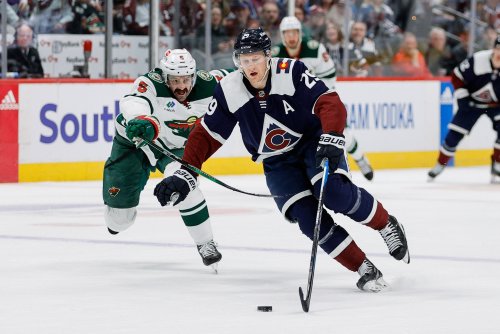
Vollman’s diagnosis of the Wild’s scoring line: “Staal really helped bring the scoring line back to life.” There is no statistical ranking in the Abstract like with the other metrics, but in looking at line combinations from the last two seasons can show how true this really is.
Props to Dobber Hockey for the compilation of data, but I want to look at the productivity of the Wild scoring line to see just exactly Vollman is talking about. First, keep in mind that this is even strength data.
Since the focus is on Staal, let’s look at the production of the 2015-16 scoring lines without Staal compared to the 2016-17 stats with the Thunder Bay-native. In doing so, you need to look at his even-strength linemates of Charlie Coyle, Nino Niederreiter, and Zach Parise.
At first thought, you’re going to think “Zach Parise took an 11 point slide in production last season, what gives?” It’s true. He had less 5-on-5 points in 2016-17 than the previous season. Parise played 51.9% of his even-strength minutes with on a line with Granny and the Mayor which accounted for 28.6% of the his total even strength offense. He was the most productive on a line with Koivu and Coyle, a line that accounted for 37.1% of his offense, but only 32.5% of his ice time. He had 13 points of offense with Coyle on the opposite wing, compared to 9 points last year.
So why the slide? I wouldn’t blame it on Staal, but rather the consistency by which he played with the same guys. In 2016-17, he only spent 43.7% of his time with the “majority” line with Staal and Coyle. In singling out Staal, 46.7% of Parise’s even-strength offense came with “Staaler” at center.
In playing less time with this top line, he only saw a one point dip in production. 30% of his EV output came with this line alone as well as 75% of his power play numbers. We already know how productive he can be with Koivu (57.1% of EV offense in 2015-16), so maybe that’s something that will come up in a pinch, a drought, or the Playoffs.
Thankfully, hockey is a team sport and there are two other players on a line to help make up for that loss. Charlie Coyle was already a 40 point scorer, but last season he broke out for 56 points (18G/38A). Eric Staal had a lot to do with this.
While Parise dropped 11 points of offense, Coyle beefed up by 14. In 2015-16, he was propped up by playing on a line with Parise and Koivu where he scored 9 points while spending 41.7% of his time with that line. His second most consistent line? 20.6% with Justin Fontaine, who spent all of last year in the AHL and is now in Russia, and buyout darling Thomas Vanek who will probably be with another team by the end of the season. Coyle scored four points playing with these jamokes.
In 2016-17, his majority lines both had Staal at center. Of his 47 even-strength points, Coyle was on a line with Staal for 55.3% of them. His strongest performances came with Nino at the opposite wing, where Coyle scored 12 points. On a line with Parise on the opposite wing (36.6% of ice time), he helped garner 10 points of offense.
While he didn’t reach the 20-goal mark he had in 2015-16, his ability to move the puck with that line allowed for the Wild to generate more offense as a unit. He also increased his special teams production, moving up from 6 points (2G/4A) to 9 points (4G/5A) on the peepers; 100% of that production coming with Staal.
Nino Niederreiter also had a career season, but 2017-18 is going to come without a safety net if he really is supposed to anchor a line with Eriksson Ek at center and Tyler Ennis at the wing (several sites have him in the bottom six). Last season, he had the most success playing on a line with Staal and Coyle for 49% of his even-strength ice time for 11 points. He only played 40.4% with his 2015-16 majority line of Koivu and Zucker, where he had 8 points.
His second most consistent line didn’t change in 2016-17, as he had Haula at center and the Mayor on the opposite wing, which accounted for 26.6% of his EV time. He was more productive with them in 2015-16 with 10 points than he was in 2016-17 with only 7 points. Staal at center accounted for 41.9% of his even-strength point production.
2017-18 is going to show just how much his success was predicated upon playing with Coyle/Parise and Staal as he’s probably going to begin the season with JEE at center and Tyler Ennis at the opposite wing. He was also a product of a good special teams season, scoring 14 points (8G/6A) up from 5 points (2G/3A) from the year before; 100% of the time, he was playing with Koivu over Staal.
So how important is Eric Staal to the scoring line? If you ask Charlie Coyle, he’s been a huge help. Parise and Staal also add experience to really help improve Coyle’s game (both are 7+ years older). Parise had a down year on the power play, even though the Wild finished 9th, but there is no doubt of the chemistry when lined up with Staal and Coyle and playing a team game is better than the individual accolades. Don’t get down on Parise.
With Nino possibly playing with a rookie center and a fragile Tyler Ennis on the opposite wing, we’re going to get to see his worth as a line leader and just how much Staal meant to his even strength offensive production. Keep in mind, he only increased his EV production by five points compared to his eleven point increase on the power play.
This could provide some ire towards the Swiss winger if he can’t replicate his power play numbers.
Up next, I’ll be taking a look at Minnesota’s Shutdown Line (which was amazing) and their Forwards Depth (not so much).
Think you could write a story like this? Hockey Wilderness wants you to develop your voice, find an audience, and we'll pay you to do it. Just fill out this form.


Recommended Comments
There are no comments to display.
Join the conversation
You can post now and register later. If you have an account, sign in now to post with your account.
Note: Your post will require moderator approval before it will be visible.