

By Tony Abbott -
On Wednesday night, Matthew Tkachuk punched the Florida Panthers' ticket into the Stanley Cup Final. The Wild Card Cats had only 92 standings points during the regular season, the fewest of any playoff team. Even one fewer point than the Calgary Flames, who missed the playoffs out West. But thanks to their superstar's heroics and a Sergei Bobrovsky renaissance, they've reached their first Cup Final since a Cinderella run in 1996.
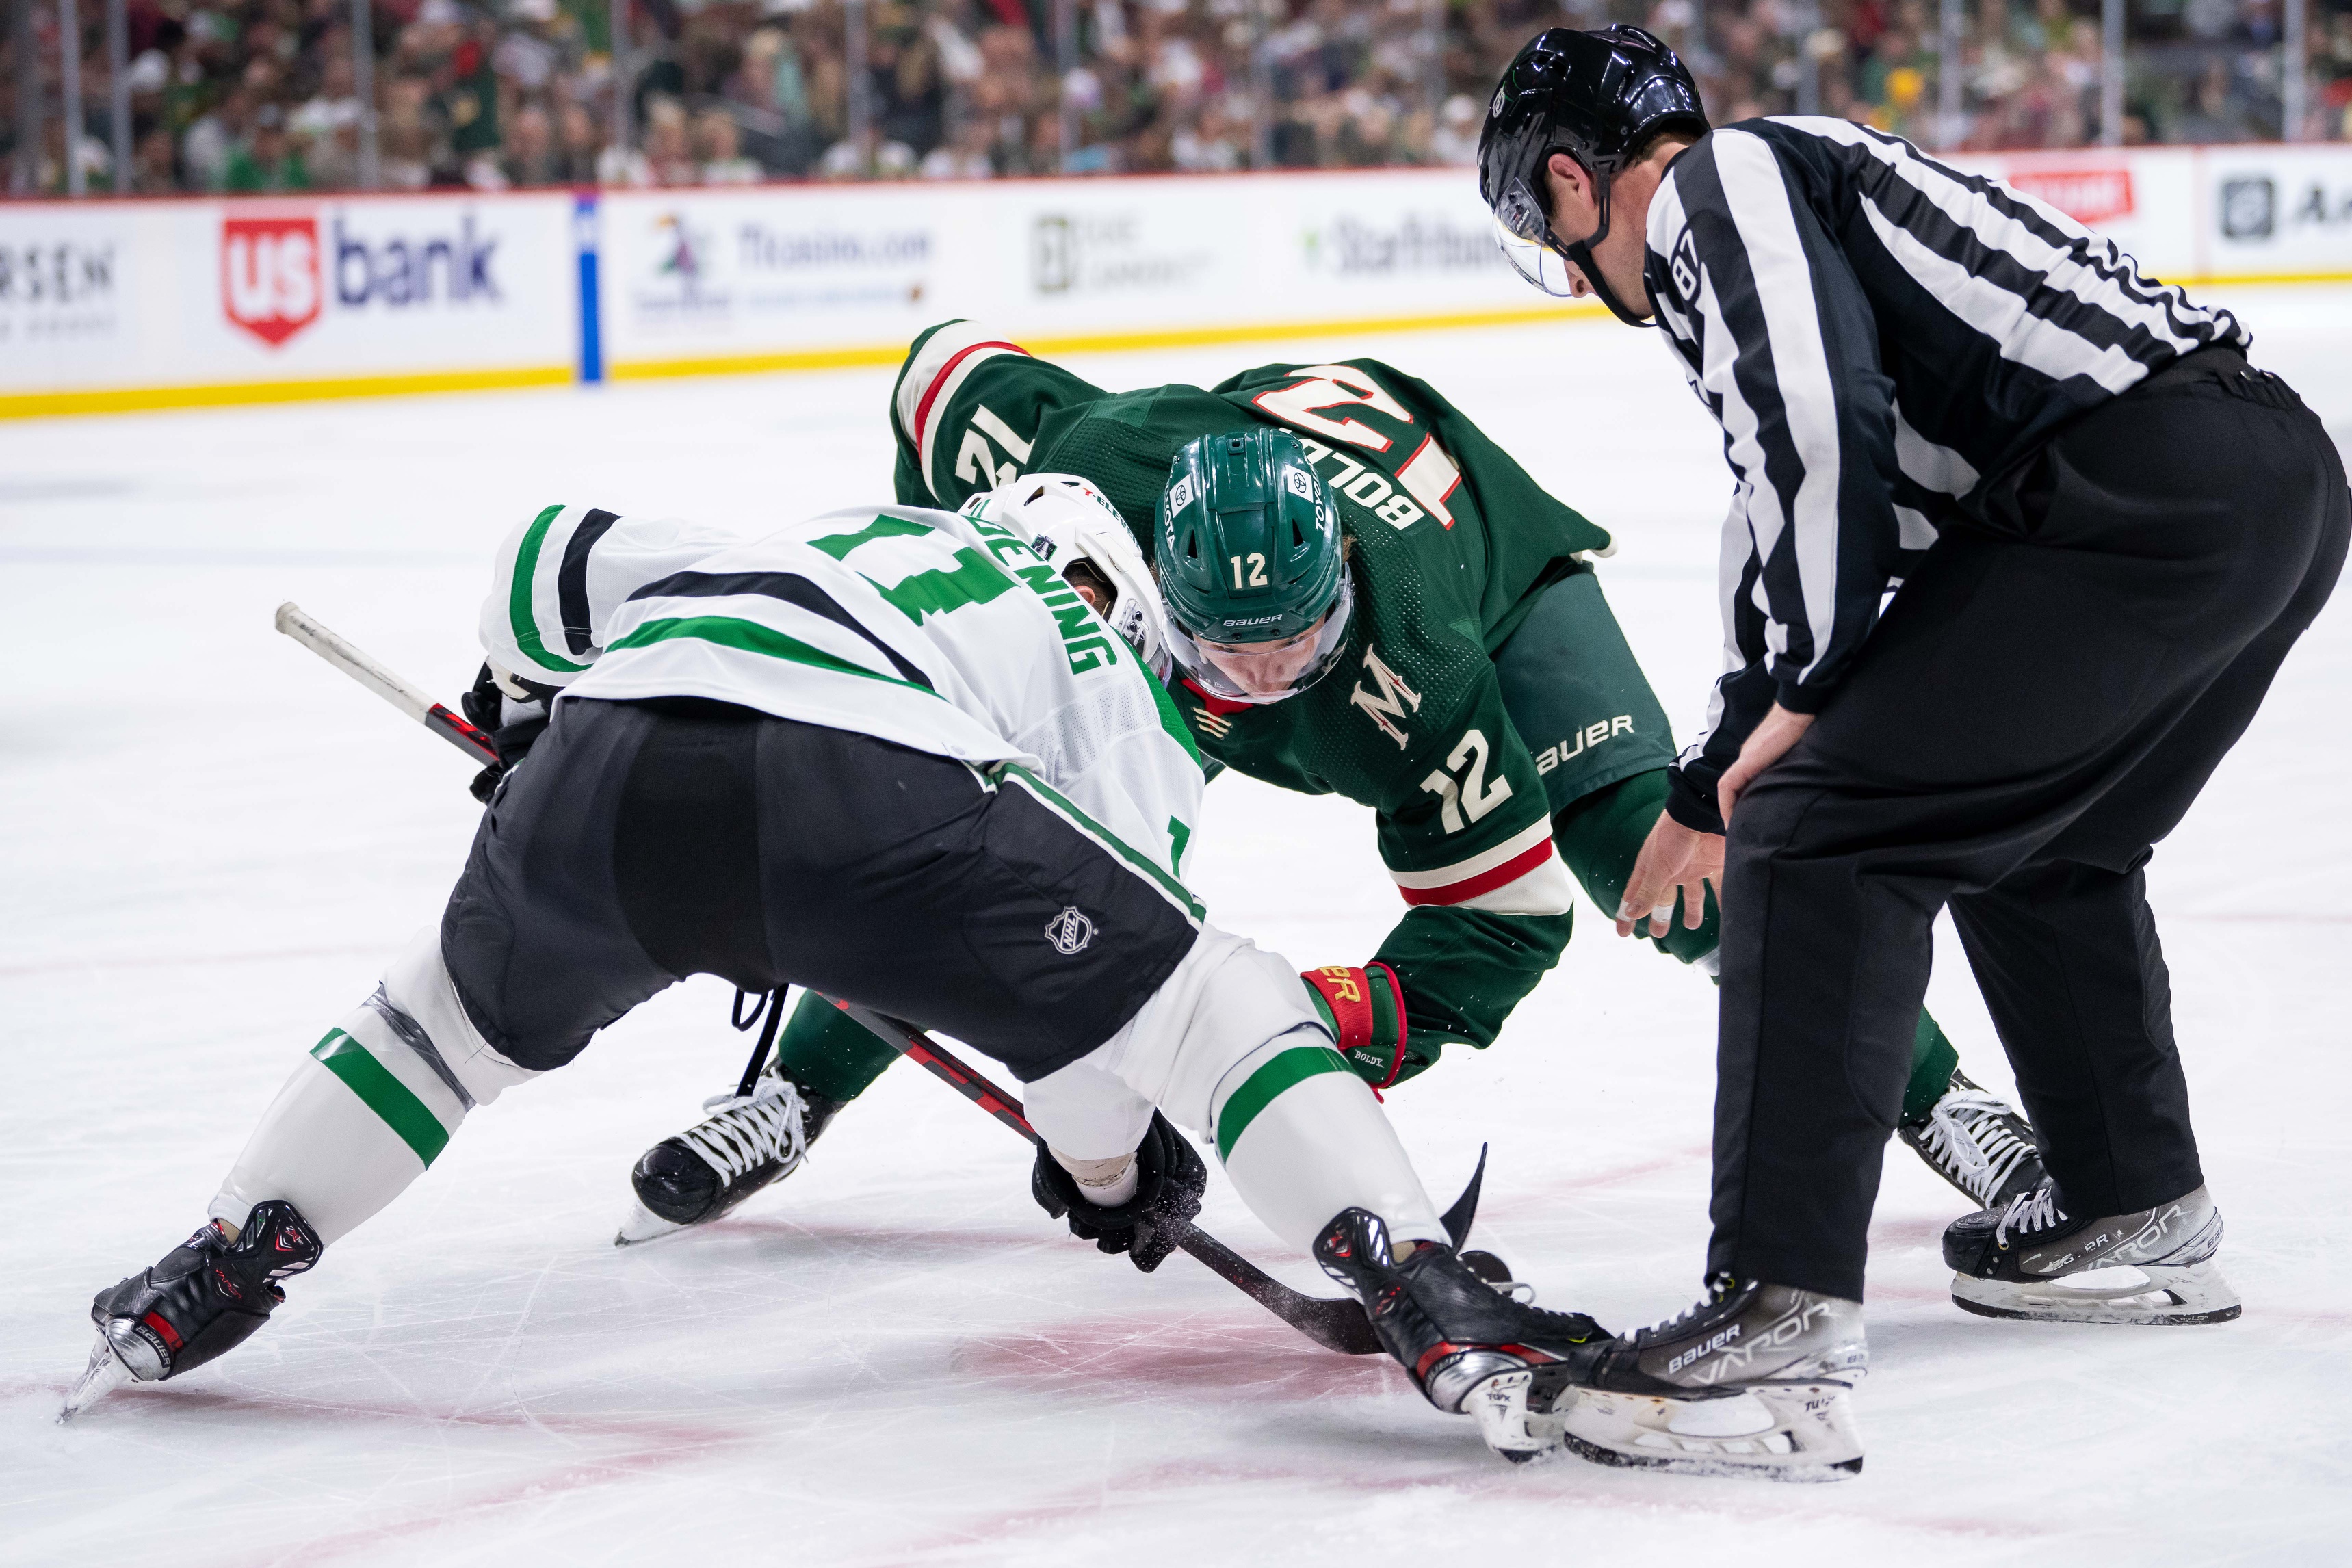
Meanwhile, the Minnesota Wild, who finished with 103 points in the standings, got knocked out by the Dallas Stars in Round 1. Why? A big reason was how poorly Minnesota performed on faceoffs. The Wild only won 43.7% of their draws against the Stars, and paid for it dearly. Dallas bounced them easily in six games. Only one playoff team finished worse than them in the faceoff dot this postseason.
If only they were more like the Florida Panthers' centers, who stand at... 14th of the 16 playoff teams, winning 44.2% of their faceoffs?
What the heck?
It's hard to watch a TV hockey broadcast without being inundated with Faceoff Propaganda. It's an easy-to-track stat that doesn't have the subjectivity of, say, scoring chances, or the abstraction of expected goals. You win a faceoff, or you don't, and hey, you can even bet on them! Joel Eriksson Ek is going against Roope Hintz, and Eriksson Ek has a 48.7% chance of taking this one, you say? We like those odds!
There's been a years-long panic about the Wild's faceoff woes. In his prime, Mikko Koivu was their ace faceoff-taker. In 2015-16 (along with Jarret Stoll and Erik Haula) and 2016-17 (with Haula and a Martin Hanzal cameo), the Wild finished third and sixth in the NHL in faceoff percentage, respectively.
Since then, it's been a long decline. Here are the year-by-year stats and rankings for Minnesota:
2015-16: 52.5% (3rd)
2016-17: 51.9% (6th)
2017-18: 49.8% (16th)
2018-19: 49.4% (22nd)
2019-20: 48.4% (27th)
2020-21: 46.5% (28th)
2021-22: 47.6% (27th)
2022-23: 47.7% (26th)
That all looks bad, and maybe it is? Kind of? It's not ideal, but the gap between their best showing and worst during that eight-year span is 6%. Minnesota partook in about 67 faceoffs per game this year. If you bumped their percentage up by six full points, they'd have been third in the NHL. How many faceoff wins per game would that bump translate to?
Four.
While the Wild are licking their wounds over lost faceoffs, the Panthers are licking their opponents despite them. During the seven games where they stunned the Boston Bruins in Round 1, Florida only won 46.2% of their draws. They just swept the Carolina Hurricanes despite taking just 45.6% of the faceoff share. And perhaps most staggering of all, they shocked the Toronto Maple Leafs in five games with just 39.1% of the faceoffs -- much, much worse than Minnesota's showing against the Stars.
You can argue that faceoffs are more important on special teams, perhaps, and they particularly mattered in Minnesota's series against Dallas. The Wild only won 29.1% of their faceoffs while on the penalty kill. The Stars scored nine power play goals in their series, with five coming within 17 seconds of Minnesota losing a faceoff.
Again, not ideal, but what's the bigger issue? The faceoffs, or the lackluster penalty killing?
Two goals came within a half-minute of Minnesota winning a draw. In Game 2, Minnesota won the faceoff on Tyler Seguin's power play goal, only to have Jason Robertson and Miro Heiskanen set up 20 seconds later with no pressure, and Jonas Brodin and Matt Dumba allowing Seguin to get right into Marc-Andre Fleury's kitchen.
The next power play goal had Sam Steel win the draw, only for Roope Hintz to break Jared Spurgeon's ankles at the blue line and dish a pass to Jamie Benn for a goal 19 seconds after. Even their third power play tally that game saw Minnesota lose the faceoff but have the puck twice — giving it away both times — before Hintz cashed in his hat trick.
Even one of those five goals that came within 17 seconds of a faceoff loss is somewhat misleading, as Seguin's power play goal in Game 4 came 15 seconds after Minnesota losing a neutral-zone faceoff. There were plenty of opportunities to stop a goal from happening after that draw.
There are three giant Wild miscues here. Hintz is able to draw both Dumba and Freddy Gaudreau to him before passing to Benn for an uncontested entry. By the net, Jake Middleton lays out to get in a passing lane, but can't find it, giving Seguin a clean shot while Marcus Johansson loses his stick completely and can only helplessly chase Seguin to the slot.
Sure, they lost the draw, but if you lose a coin flip minutes before tripping on a curb, then get hit by a car walking into traffic, then fall into an open manhole, is it because you lost the coin flip? Or is it because you didn't pay attention to a few other details?
Even on some of the goals that have a much cleaner line of logic from lost faceoff to power play goal, the Wild were ineffective way beyond not getting a draw. Robertson's Game 5 power play goal sees Minnesota allow Dallas to zip the puck around the perimeter nearly uncontested. Johansson is just zipping around from station to station a half step behind, while no one else is really disrupting passing or shooting lanes.
Is it the faceoffs, or was this just a bad performance all around by Gaudreau and Johansson? After all, both of them are tied for fourth in the entire playoffs with six goals against while shorthanded this postseason. It's easy to point to Gaudreau's 25% success rate (4-for-16) in the dot as a reason why.
But that doesn't explain why Connor Dewar, who won just two of his seven faceoffs (28.6%), only surrendered one power-play goal. Especially since the only goal Dallas scored against him on the man advantage was after Dewar won a draw.
Bobrovsky playing out of his mind helps, of course. But Florida showed that Minnesota could've been competent on the penalty kill without winning faceoffs. Between their Toronto and Carolina series, the Panthers went 14-for-39 on shorthanded faceoffs (35.9%). They surrendered four goals, total, throughout those series. If you gave Minnesota that same success rate in their 37 shorthanded draws, they'd have 13 wins out on 37 tries, as opposed to their 11.
We're talking about the difference between two faceoffs. Pick whichever two draws you want, and change them from losses to wins. Did you stop the penalty kill from being bad? Did you change the tenor of the series? No.
It makes for a good talking point, and a concrete number for the coaching staff and players to try to improve, but the fact is that the Wild have a lot more things going against them than winning four fewer faceoffs per game than the top teams in the league. Maybe they're better served trying to clean up the stuff that happens after the faceoff instead.
All faceoff data via NHL.com, all other data via Evolving-Hockey.
Think you could write a story like this? Hockey Wilderness wants you to develop your voice, find an audience, and we'll pay you to do it. Just fill out this form.
-
 1
1
-
 1
1


Recommended Comments
Join the conversation
You can post now and register later. If you have an account, sign in now to post with your account.
Note: Your post will require moderator approval before it will be visible.