Jump to content
Hockey Wilderness
  • How Much Has Goaltending Influenced the Wild's Red-Hot Penalty Kill?


    Image courtesy of Sergei Belski-USA TODAY Sports
    Justin Hein

    Napoleon Bonaparte famously said: “Soldiers generally win battles. Generals get credit for them.” It’s rare to quote a Frenchman on hockey, let alone one who died before the game was invented. But it always comes to mind when discussing NHL coaching for two reasons

    The first is obvious: the players’ preparation and performance are always more important than the guy behind the bench. Beyond that, though, consider the source of the quote. Napoleon’s strategies revolutionized recruitment and warfare, which can’t be ignored when explaining his success. 

    So, whether we’re discussing a battlefield or a sheet of ice, how do we determine if the coach is doing a good job? 

    The best tool to answer that question is a combination of film and analytics. We have thoroughly broken down John Hynes’s tactical improvements at Hockey Wilderness, including his penalty kill structure. Hynes’s adjustment is twofold: the forwards help defend their blue line in transition, and they defend the sweet spot in their own zone. He asks them to be less aggressive than Evason’s penalty kill but not too passive to achieve this. 

    Under Hynes, the Wild have surrendered only three goals on their 24 penalty kills, an 87.5% success rate. That’s an unsustainable pace. It would have led the NHL last year. Minnesota was dreadful at killing penalties this season before Bill Guerin relieved Dean Evason of his coaching duties. When a team improves that quickly, the most likely explanation is a hot string of goaltending. That raises the question, did Hynes’s new tactics even play a part? 

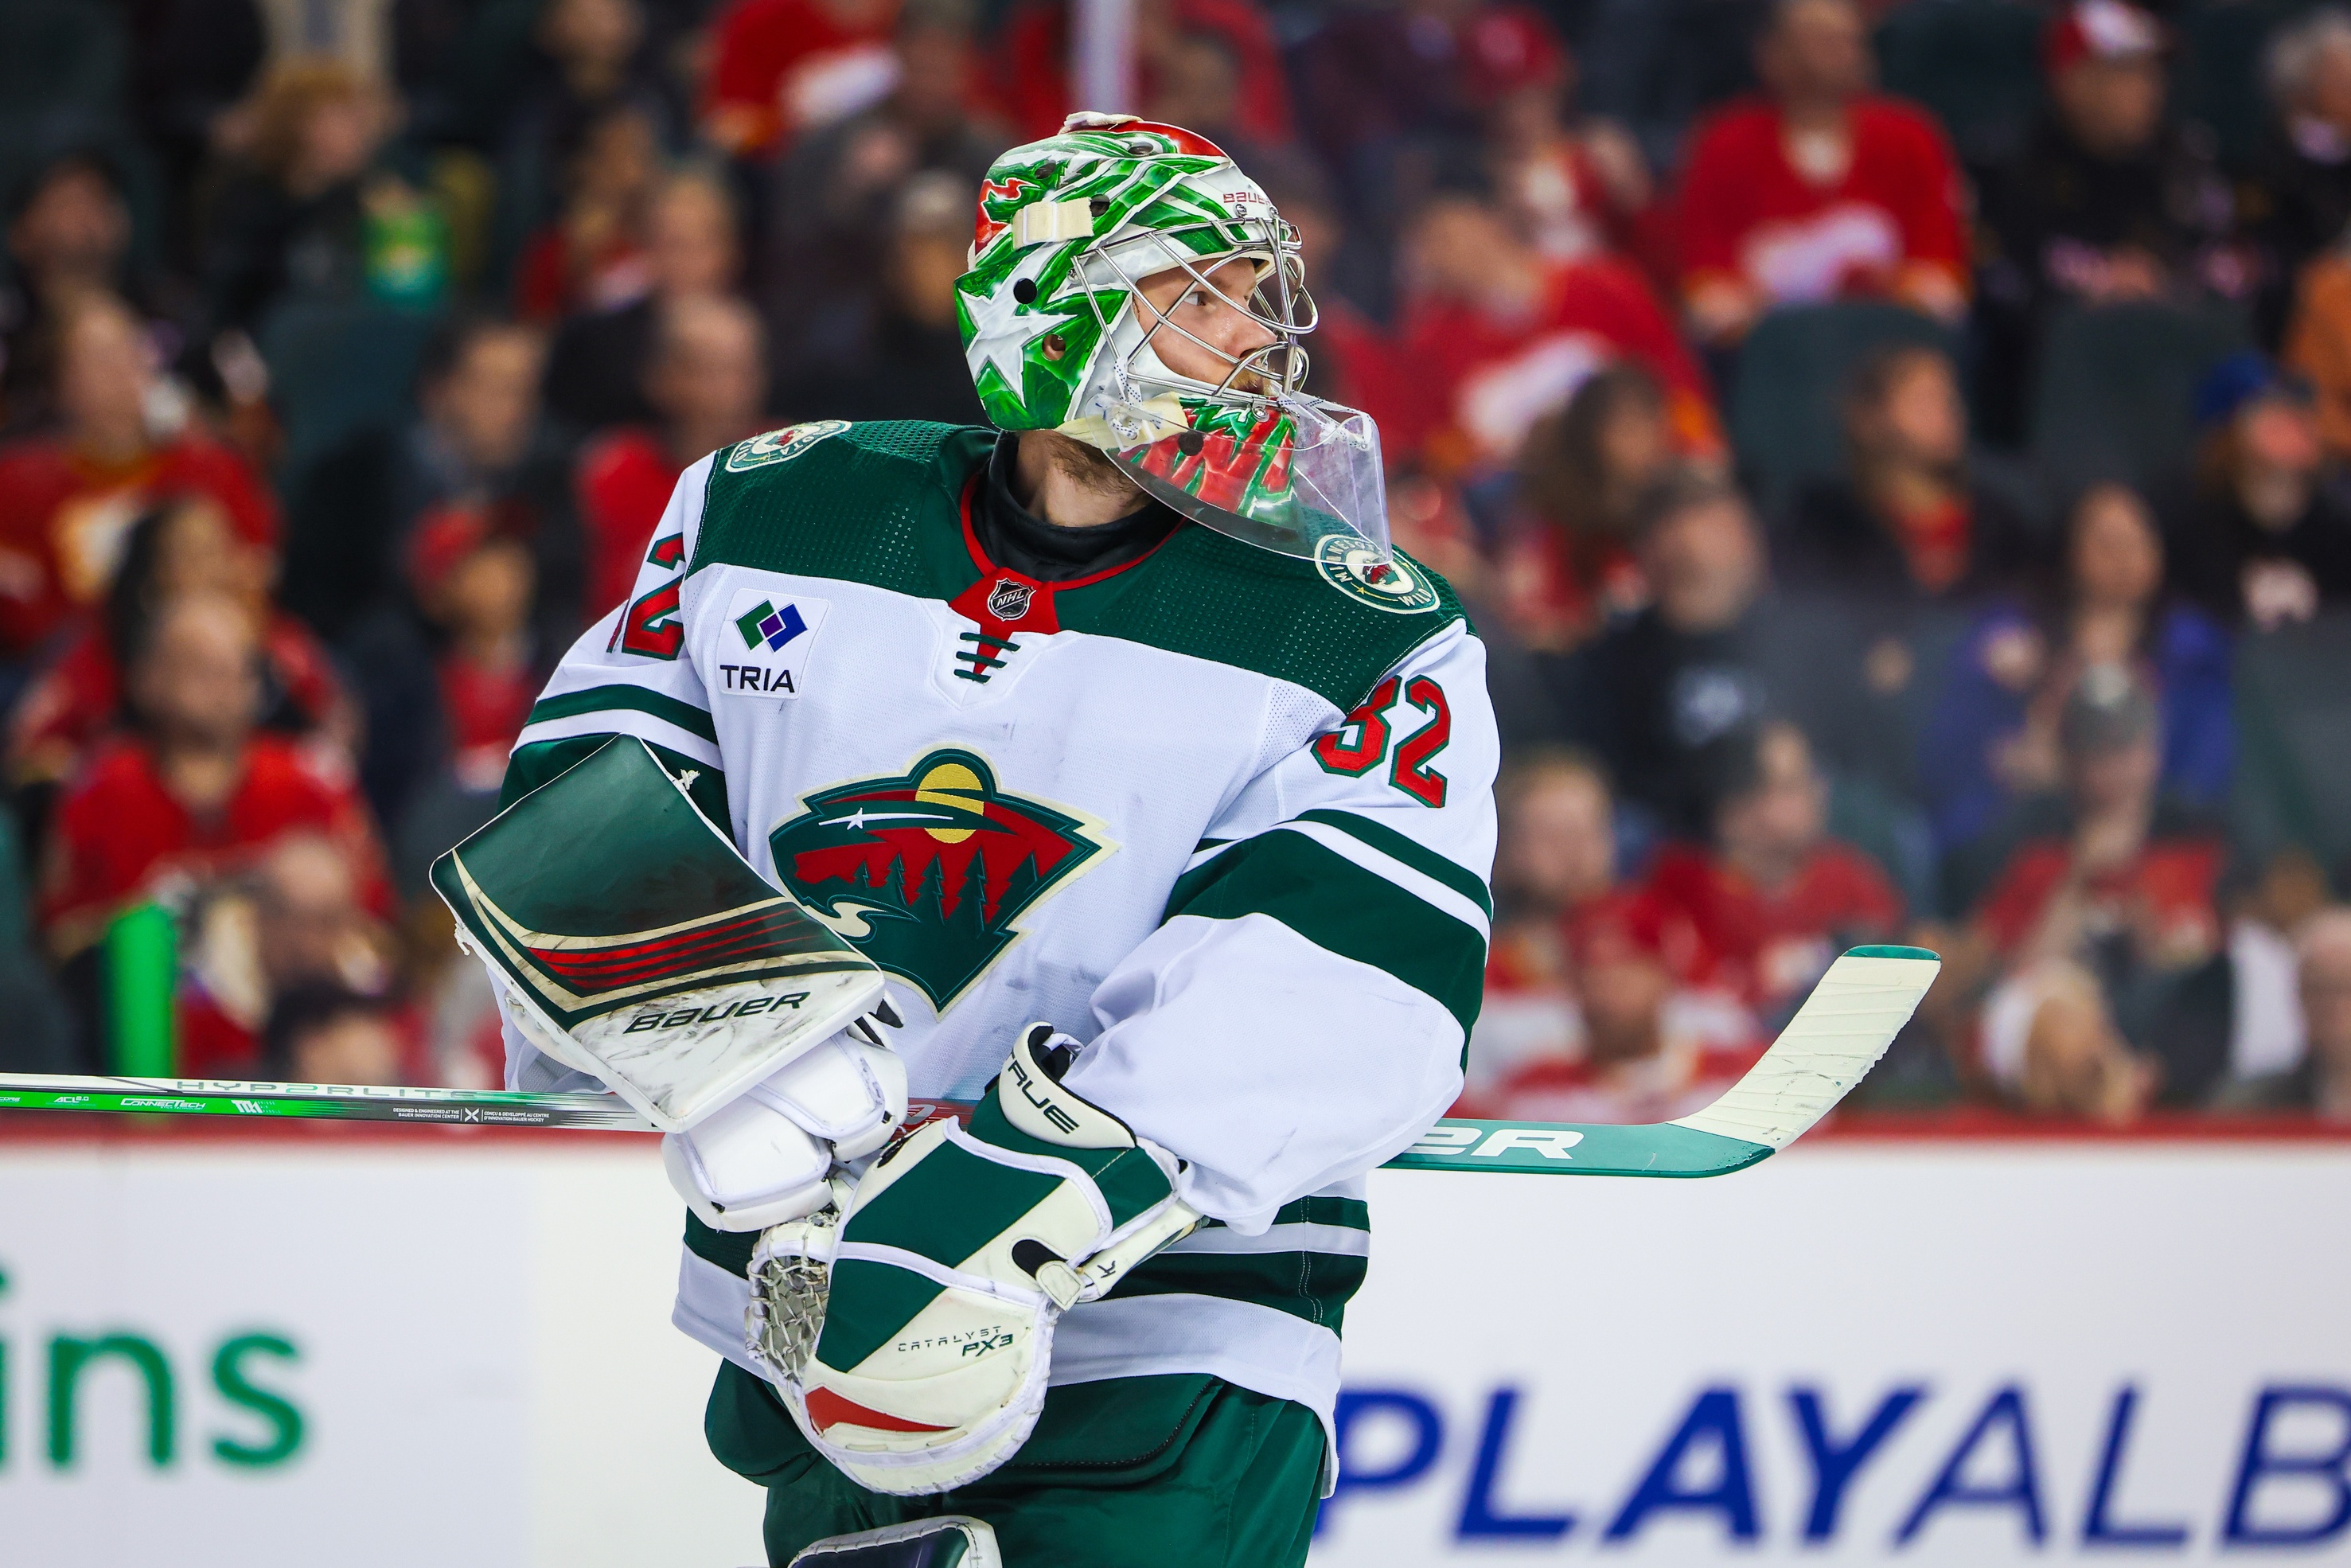
    It’s no secret that Filip Gustavsson and Marc-Andre Fleury have turned their shorthanded performance around after Hynes arrived. But the team also seems to be playing better in front of its goaltenders. We can determine that by separating defensive play from goaltending performance. 

    The analytics that best isolate goaltending play use expected goals, a statistic based on shot location. Statisticians record every NHL shot by location and track every previous event (for example, a pass, deflection, or save). That provides a lot of useful information to answer important questions. How far apart were the events, how fast did the puck get to the shooter, and how much did the goaltender’s angle change? 

    All these factors influence how hard it is to save the shot, and harder shots are given a higher probability of scoring. A shot with a 40% chance to score would be worth 0.4 “expected goals” (xG). A shot with a 40% chance of going in would be a very high xG value for just one shot. 
    Good penalty kills limit these shots by covering dangerous passing options, blocking shots, or clearing the puck from their zone. When a shorthanded defense gives up a lot of xG, that reflects poorly on the skaters and coaches. 

    Based on MoneyPuck.com’s expected goals model, Minnesota’s penalty kill improved measurably after implementing a new system. The Wild have given up 12% fewer four-on-five xG per minute than Evason’s 2023-24 squad. 

    Evason’s penalty kills prevented low-danger chances better than the new system, but Hynes makes up for that with a safer shorthanded strategy. The new system has reduced medium-danger (8 to 20% chance of a goal) and high-danger (more than 20%) shots, which drives the overall reduction in scoring danger. 

    That’s especially exciting because it matches what Minnesota wants to do on film. By dropping the forwards deeper into the zone, opposing power plays only have room to operate from the point. In other words, Hynes’s plan is working. 

    Even more noteworthy is that while Hynes’s structure has reduced the count of shot attempts by 8%, that doesn’t fully capture the team’s improvement. That means that Hynes’ new system prioritizes shot quality rather than shot quantity. Evason’s all-or-nothing approach led to more dangerous chances for opposing power plays. 

    In some cases, Evason’s pressure was productive. Minnesota ranked third in the NHL with 14 shorties last year. Still, if Hynes’s squad sacrifices all 14 of those for this new system, the Wild are on track to save around 8 expected goals if they take the same number of penalties this year as last year. That’s a pretty close figure. 

    Other considerations affect this data, many of which favor Hynes. For example, Hynes has played only two of seven games at home. That means that opposing coaches have the last-change advantage. Opposing coaches can hand-pick their players based on the Wild’s personnel. That should lower Minnesota’s faceoff percentage, but Hynes and Evason’s squads have nearly identical faceoff percentages. It should also make the PK easier to attack, but Hynes’s group has still outperformed Evason’s by xG-against (xGA). 

    Another hidden benefit of the new scheme is that Minnesota has been penalized far less while killing penalties. Under Hynes, Minnesota has reduced their four-on-five penalties-per-minute by 71%. That means they don’t have to kill five-on-three power plays or remain shorthanded for more than two minutes. 

    Part of this drastic reduction may be the influence of a new coach -- nobody wants to be that guy with a new boss. But it’s also a credit to good positioning. Across the board, this scheme has given better results. 

    Still, goaltending is responsible for most of the turnaround. Just as xG can isolate defense from goaltending, they can isolate goaltending performance. By MoneyPuck’s estimation, Fleury and Gustavsson have saved about 2.76 goals above expectation (GSAx). 

    This means that, even after accounting for the penalty-killing improvements, Minnesota’s goaltenders have out-paced an average goaltender. If you tack those 2.76 “expected goals” onto the Hynes PK total, it estimates their performance with average goaltending. Instead of going 21 for 24, the team would be closer to 18 or 19 out of 24. 

    That’s only a 76% success rate, which would rank 25th in the league this year. With average goaltending, the new penalty kill is better -- but still bad. 

    However, these analytics overrate the goaltenders’ contributions. xG is a great tool, but statisticians calculate it in a vacuum of shots and saves. It doesn’t include a good measurement for rebound control. Goalies are responsible for their own rebounds, complicating the issue. Screens can make rebound control more difficult through no fault of the goaltender's. Furthermore, defensemen are also responsible for clearing rebounds. In other words, not all rebounds are created equal. 

    Minnesota’s goaltenders can’t freeze a puck to save their lives this season. They have combined for only three puck freezes while shorthanded this season. That’s almost impossibly low, considering the Wild have given up 92 power-play opportunities this season. Given the extreme poor performance, it’s safe to blame the goaltenders for most rebound issues. 

    Under Hynes, the rebound control has been better. That’s likely because the penalty kill applies better pressure. Fewer scoring chances mean fewer rebounds. So, in that sense, we should credit Hynes with a portion of the goaltenders’ improved rebound control. 

    On top of that, it’s much easier to freeze the puck on a shot from distance. For goaltenders, that’s the difference between catching a pop fly in the outfield versus a line drive in the infield. In this way, we should give Hynes’s scheme some credit for addressing the goalies’ weaknesses. 

    Analytics are the best tool to isolate goaltending from shooting, but they’re not perfect. The numbers seem to prove that while coaching has reduced their opponents’ scoring chances, Fleury and Gustavsson are the main reason the penalty kill looks better. Still, the little things that originate on the bench have a way of seeping into every aspect of the on-ice product. It makes them challenging to measure. 

    Ultimately, every member of the team contributes to each other’s success. Their job is to make each other’s job easier. Perhaps that’s why Emperor Napoleon was so willing to pass around the credit. 

    Think you could write a story like this? Hockey Wilderness wants you to develop your voice, find an audience, and we'll pay you to do it. Just fill out this form.

    • Like 2
    • Thanks 1

    User Feedback

    Recommended Comments

    Featured Comments

    Gus's save percentage and GAA before Sweden was like 80th-90th in the league, and now he's 25th-30th. Season SV% finally peaked above .900 too.  Fleury hasn't ben AS good, but still, he has also improved.

    Everything in this game is a matter of seconds and even instants in the difference between a great play and a bad one.  Whatever the reason, goaltending is definitely a good sign right now.

    Link to comment
    Share on other sites

    9 minutes ago, Citizen Strife said:

    Gus's save percentage and GAA before Sweden was like 80th-90th in the league, and now he's 25th-30th. Season SV% finally peaked above .900 too.  Fleury hasn't ben AS good, but still, he has also improved.

    Everything in this game is a matter of seconds and even instants in the difference between a great play and a bad one.  Whatever the reason, goaltending is definitely a good sign right now.

    It's definitely better, but goaltending can be fluky -- hot streaks aren't uncommon, and they don't always have an explanation. The good news is, at least some of this improvement is sustainable. 

    Hopefully with these changes on tape, other teams still have trouble setting up PP chances. I wrote this before the Calgary game last night, which was the first time that Hynes played another team twice. the flames racked up about 2 xG at 5v4, which is a lot for only three penalty kills. That's somewhat concerning. 

    Link to comment
    Share on other sites

    "How Much Has Goaltending Influenced the Wild's Red-Hot Penalty Kill?"

    I've never played goalie, but it stands to reason in my head that better goalie play and better PK defense work hand-in-hand. If one isn't worried about the other and over-playing their role in order to compensate, they're more likely to perform their role more efficiently.

    But what do I know?

    Link to comment
    Share on other sites

    Great article Justin. I love the breaking down of analytics into layman's terms. There were 3 things that weren't covered and I'd like to add to them:

    1. The eye test
    2. goalie confidence
    3. quality of opposition

    The analytics always has to be confirmed by the eye test. In this eye test, it appears that packing in the middle has led to shots from better angles for the goalies and has allowed for better rebound clearance. Specifically with Goose2, he seems way more calm in net than previously, as on many of those high danger chances, he was hung out to dry with no chance to stop the puck. The guy, I believe who was the most victimized here was Middleton who constantly had a 2-1 in tight against him and had to choose. He normally chose poorly.

    The 2nd item is goalie confidence. This also affects the team in full team confidence, as many times under Evason they'd skate back to the bench with their heads down. But goalies playing with confidence are much tougher to beat. This is most true with Goose2 as he has a tendency to back into his net when his confidence wanes. When he's confident, he's challenging shooters. If this new tactic helps goalie confidence, that is a main factor into why the goalies are seemingly playing better. Personal confidence in sports is underrated for player's success. 

    Let's use some different examples. Mahomes is having a bad statistical year. By all statistical marks, he's down. But, if you watch him, he's doing the same things he's always done, and his receivers are dropping balls. His confidence is low in his teammates ability to hang on except for Kelce. But, when Kelce's covered, he has to throw in another direction. 

    Contrast that with Tom Brady who exuded confidence almost from the time he was drafted. Even with below average receivers, Brady figured out how to make it work. When given a season with Moss, magic happened. 

    In baseball, pitching and hitting is the same type of thing. How do players have career years and then fall apart later? The main thing has to do with confidence. Of course, injuries also play a part. 

    And nowhere in sports does confidence play a part in a player's performance quite like golf. Bernhard Langer's struggles are legendary. But runs by some players followed by droughts are common. Jordan Spieth is a good example of how confidence waned and so did his performance. Tiger is an excellent example of playing with high confidence for a long time. His red shirt Sunday is legendary. It said, "here comes Tiger" and all eyes were on Tiger to make a comeback or seal the deal. Confidence is huge!

    Lastly, we have to look at the quality of the competition. While not all rebounds are created equally, so also, not all PPs are created equally. Through this streak, the Wild have faced some pretty pathetic PPs which I believe have inflated statistics a bit. The stats assume an average PP. But we found when facing Edmonton, that the system wasn't bullet proof. Yet, in facing Calgary twice, St. Louis and I believe Nashville and Seattle, you could tell that their PP was below average (being nice). 

    How would Hynes' PP unit have held up against the beasts of the east that Evason's group faced? I'd suggest better, but not 87.5%. And, when facing a lower quality PP, and getting success, doesn't that help a goalies' confidence, and the eye test? 

    I still maintain that the highest contributing factor to where the Wild are now has to do with the heavy Eastern Conference schedule early on. This year, the East is way better than the West. They're faster and play with a better edge. But, if the team was confident, could they have faired better? Probably!

    Within the article, we were referring to Hynes' PK vs. Evason's PK. Being that Evason is not an Xs & Os guy, I think the real comparison is Woods' PK. If you go back and look at the numbers, Woods' PK has been falling since his Boudreau days. The way I see it, Evason and Woods talked in the offseason about the PK and strategy. One of them came up with the high pressure idea since it was kind of a thing. But, it was up to Woods to draw up the strategy. So, why not have Dwyer get some credit? Perhaps the implementation is heavy with Dwyer, but the team had hardly even had introductions before they were playing, and it was obvious that Hynes changed the strategy. Maybe the players never truly bought in either? 

    • Like 2
    Link to comment
    Share on other sites

    2 hours ago, FredJohnson said:

    "How Much Has Goaltending Influenced the Wild's Red-Hot Penalty Kill?"

    I've never played goalie, but it stands to reason in my head that better goalie play and better PK defense work hand-in-hand. If one isn't worried about the other and over-playing their role in order to compensate, they're more likely to perform their role more efficiently.

    But what do I know?

    They're very symbiotic, but you could have a penalty kill give up a lot of chances with a goaltender standing on his head, and vice versa. Typically when a team's goalie stands on his head and isn't a perennial Vezina candidate, it's not sustainable. That's why I wanted to investigate this question, given that the team has a new coach. 

    Hynes has improved the PK mildly, but it's unrealistic to think he's the reason that Gustavsson and Fleury are playing so well on the PK. 

    • Thanks 1
    Link to comment
    Share on other sites

    1 hour ago, mnfaninnc said:

    Great article Justin. I love the breaking down of analytics into layman's terms. There were 3 things that weren't covered and I'd like to add to them:

    1. The eye test
    2. goalie confidence
    3. quality of opposition

    Absolutely. I didn't go too deep on the film since Justin Wiggins already did so here: 

    That being said, you're absolutely right that there's more to the game than jus the numbers, which I tried my best to account for. In the end, some of this goaltending is helped by Hynes's system in ways that aren't fully captured by the data, and that has to make them more confident. 

    Quality of competition is hard to measure as well, so the best way to monitor that is to see how the PK performs in some tougher upcoming games. I'll be watching closely when they play some better power plays soon.  In the meantime, I don't want to hold it against them since they're playing well.

    Thanks for reading! 

    • Like 4
    Link to comment
    Share on other sites

    19 hours ago, Justin Hein said:

    That being said, you're absolutely right that there's more to the game than jus the numbers, which I tried my best to account for. In the end, some of this goaltending is helped by Hynes's system in ways that aren't fully captured by the data, and that has to make them more confident. 

    Quality of competition is hard to measure as well, so the best way to monitor that is to see how the PK performs in some tougher upcoming games. I'll be watching closely when they play some better power plays soon.  In the meantime, I don't want to hold it against them since they're playing well.

    Success and facing less difficult shots that you CAN save definitely add to confidence. And a confident goalie then has a better shot at the impossible saves. And, as you said in the article, some of these things play off each other. The hard thing about the data are the intangibles present, and confidence is one of them. And just like confidence, momentum is another. 

    For those out there not being able to put a finger on how a Foligno big hitting shift does anything, it's because it's an intangible. Big hitting shifts, especially at home, get the crowd energized, and an energized crowd fires up the players who just start feeling it more. If you want the team to wake up on time, get the crowd going early (especially for afternoon games) by putting out a heavy shift early. We have a lot of centers who play wing. Start out with a Duhaime/Foligno/Maroon line with Middleton and Bogosian on D. Their only intent on that shift is to throw as many big hits as they possibly can without drawing a penalty. Get the crowd roaring, and send out the skill. 

    I think we saw what quality of competition did for the PK, and it brought some confidence. But, look at what happened when we faced Edmonton, a real good PP? It wasn't very good. So, there's still work to do. I think Vancouver's PP also had a pretty decent night. 

    Justin, I'll be waiting for your assessment of our other special teams. It seems like all units are down this season, and have been moving lower except for the PP. PP is mainly just treading water statistically, I think.

    Also, could a statistic for both of these units, be better represented by time to score? For instance, and these are fictional numbers, if under Evason it took :58 to score, vs. under Hynes it takes 2:22 to score on our PK? I would think that would have some bearing on where our PK and PP stand. PP & PK% is kind of antiquated, especially when a partial one counts as 1. 

    I'd also like to know on PPs what the stats say about having a legit player present in Ovechkin's office does for a PP. For instance, it was evident against Calgary that they had no such threat. In essence, the Wild were able to kind of overplay the right side on the PK with no left side threat. I'd think it would be an interesting study, but one I have no time to do.

    • Like 1
    Link to comment
    Share on other sites

    3 hours ago, mnfaninnc said:

    Success and facing less difficult shots that you CAN save definitely add to confidence. And a confident goalie then has a better shot at the impossible saves. And, as you said in the article, some of these things play off each other. The hard thing about the data are the intangibles present, and confidence is one of them. And just like confidence, momentum is another. 

    For those out there not being able to put a finger on how a Foligno big hitting shift does anything, it's because it's an intangible. Big hitting shifts, especially at home, get the crowd energized, and an energized crowd fires up the players who just start feeling it more. If you want the team to wake up on time, get the crowd going early (especially for afternoon games) by putting out a heavy shift early. We have a lot of centers who play wing. Start out with a Duhaime/Foligno/Maroon line with Middleton and Bogosian on D. Their only intent on that shift is to throw as many big hits as they possibly can without drawing a penalty. Get the crowd roaring, and send out the skill. 

    I think we saw what quality of competition did for the PK, and it brought some confidence. But, look at what happened when we faced Edmonton, a real good PP? It wasn't very good. So, there's still work to do. I think Vancouver's PP also had a pretty decent night. 

    Justin, I'll be waiting for your assessment of our other special teams. It seems like all units are down this season, and have been moving lower except for the PP. PP is mainly just treading water statistically, I think.

    Also, could a statistic for both of these units, be better represented by time to score? For instance, and these are fictional numbers, if under Evason it took :58 to score, vs. under Hynes it takes 2:22 to score on our PK? I would think that would have some bearing on where our PK and PP stand. PP & PK% is kind of antiquated, especially when a partial one counts as 1. 

    I'd also like to know on PPs what the stats say about having a legit player present in Ovechkin's office does for a PP. For instance, it was evident against Calgary that they had no such threat. In essence, the Wild were able to kind of overplay the right side on the PK with no left side threat. I'd think it would be an interesting study, but one I have no time to do.

    MnFaninnc handing out assignments! I like it.

    Link to comment
    Share on other sites

    On 12/16/2023 at 9:14 AM, mnfaninnc said:

    Also, could a statistic for both of these units, be better represented by time to score? For instance, and these are fictional numbers, if under Evason it took :58 to score, vs. under Hynes it takes 2:22 to score on our PK? I would think that would have some bearing on where our PK and PP stand. PP & PK% is kind of antiquated, especially when a partial one counts as 1. 

    I'd also like to know on PPs what the stats say about having a legit player present in Ovechkin's office does for a PP. 

    The best analytic available for assessing PK and PP is xG per 60. This is based on the same shot location data, and it's essentially equal to "(total scoring chance quality) divided by (time on the ice)." This way, if PP takes less time to score they aren't punished for it. 

    To your point about elite scorers, this is not captured by the above stat because shots from the point are lower quality -- but obviously not in all cases, as with Ovi. Over a large sample size (two to three seasons), a player can prove they out-score their individual xG totals, and MoneyPuck has accounted for this by creating "Shooting Talent Adjusted xG". At this point the analysis gets a bit more fuzzy than hard numbers, because a PP with a middling xG/60 is probably more like a top-10 power play, and you just have to account for that in your head. 

    Boeser leads the NHL in five-on-four shooting talent adjustd xG, with 7.7 . His individual xG (not adjusted for talent) is 7.0 -- so, it doesn't make a huge difference, maybe a few goals per season for the truly elite power play guys. 

    Link to comment
    Share on other sites

    14 minutes ago, Justin Hein said:

    The best analytic available for assessing PK and PP is xG per 60. This is based on the same shot location data, and it's essentially equal to "(total scoring chance quality) divided by (time on the ice)." This way, if PP takes less time to score they aren't punished for it. 

    To your point about elite scorers, this is not captured by the above stat because shots from the point are lower quality -- but obviously not in all cases, as with Ovi. Over a large sample size (two to three seasons), a player can prove they out-score their individual xG totals, and MoneyPuck has accounted for this by creating "Shooting Talent Adjusted xG". At this point the analysis gets a bit more fuzzy than hard numbers, because a PP with a middling xG/60 is probably more like a top-10 power play, and you just have to account for that in your head. 

    Boeser leads the NHL in five-on-four shooting talent adjustd xG, with 7.7 . His individual xG (not adjusted for talent) is 7.0 -- so, it doesn't make a huge difference, maybe a few goals per season for the truly elite power play guys.

    So, sitting on this, and having a couple of seasons of data, how does Kaprizov, Boldy, and Ek fair in the adjusted xG? And then, how do they look just this year?

    Perhaps the PP is a good concept and we just aren't burying chances? These things run in cycles, typically.

    Link to comment
    Share on other sites


    Join the conversation

    You can post now and register later. If you have an account, sign in now to post with your account.
    Note: Your post will require moderator approval before it will be visible.

    Guest
    Add a comment...

    ×   Pasted as rich text.   Paste as plain text instead

      Only 75 emoji are allowed.

    ×   Your link has been automatically embedded.   Display as a link instead

    ×   Your previous content has been restored.   Clear editor

    ×   You cannot paste images directly. Upload or insert images from URL.


×
×
  • Create New...